 Rubii: AI Character Community

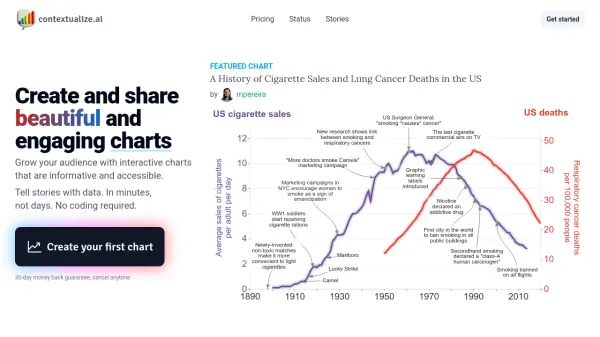
What is contextualize.ai?
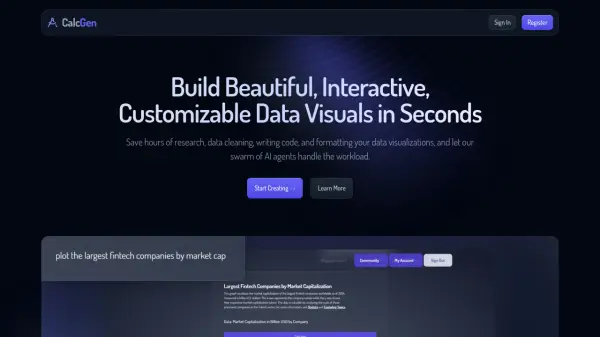
This platform empowers users to transform raw data into engaging visual narratives. By uploading a CSV file or selecting from an existing library, individuals can instantly generate interactive charts. The tool facilitates adding context through annotations, allowing users to highlight significant events or periods directly on the chart. URLs pasted into the annotation feature are automatically processed, fetching content and placing it accurately based on date.
Furthermore, contextualize.ai integrates AI capabilities (GPT-3.5 and GPT-4) to help users discover insights within their data by selecting specific time ranges. Once a chart is annotated and insights are added, users can incorporate titles and descriptive text to finalize their data story. These finished stories can be easily embedded onto websites, newsletters (like Substack), or shared across social media platforms such as X (Twitter) and Reddit, enhancing audience engagement without requiring any programming skills.
Features
- CSV Upload & Automatic Chart Generation: Instantly create charts by uploading CSV files.
- Interactive Annotations: Add contextual notes and highlights to charts.
- URL Content Processing: Automatically fetch and place web content as annotations based on date.
- AI-Powered Data Insights: Leverage GPT-3.5/GPT-4 to uncover insights within specific data periods.
- Data Storytelling Interface: Combine charts, annotations, titles, and prose into a narrative.
- Embedding & Sharing: Easily embed charts on websites (Substack, etc.) and share on social media (X/Twitter, Reddit).
- Image Export: Download created charts as PNG files.
- Community Datasets Access: Utilize datasets shared by other users (plan dependent).
- Private Datasets: Option to keep datasets private (plan dependent).
Use Cases
- Creating interactive data visualizations for articles and blog posts.
- Sharing data-driven insights effectively on social media platforms.
- Enhancing newsletters and reports with engaging, annotated charts.
- Building a personal online portfolio of data analysis and visualization projects.
- Presenting research findings visually with contextual timelines.
- Tracking and illustrating market trends or historical data with relevant annotations.
FAQs
-
Why can I only create and share charts with a paid account?
Having paying customers helps validate that the tool is valuable and supports ongoing development towards potentially working on it full-time. -
What if I just want to create charts once?
You can subscribe to a monthly plan, create your charts, and then cancel the subscription. Your created charts will remain accessible. -
Is a free trial available?
A free trial is being considered and worked on. -
How can I cancel my subscription?
Cancel anytime by navigating to your profile, clicking 'manage subscription', and then selecting 'cancel plan'. -
What is the refund policy?
If you're unsatisfied for any reason, email murilo@contextualize.ai within 30 days for a full refund, no questions asked.
Related Queries
Helpful for people in the following professions
contextualize.ai Uptime Monitor
Average Uptime
99.85%
Average Response Time
1018.47 ms

Featured Tools
Join Our Newsletter
Stay updated with the latest AI tools, news, and offers by subscribing to our weekly newsletter.