What is Grafieks?
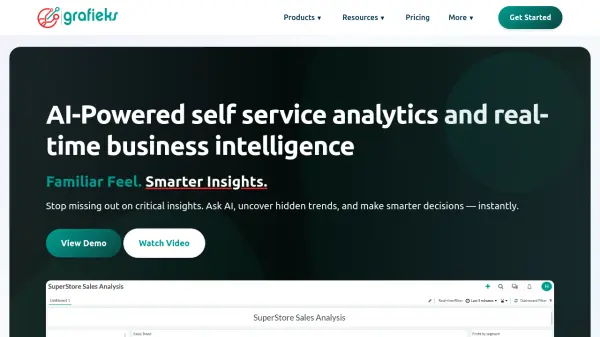
Grafieks is an advanced analytics platform that leverages artificial intelligence to provide automated insights, real-time data analysis, and intuitive data visualizations for organizations of any size. Designed with a drag-and-drop interface and AI-powered features, it empowers users to ask questions in plain English, uncover hidden trends, and generate detailed reports without technical complexity.
The platform consolidates multiple data sources, offers robust integrations with major databases, and supports collaborative dashboard sharing for seamless teamwork. Grafieks ensures data privacy with end-to-end encryption and never stores your actual data—only the schema—to optimize performance while maintaining security. With real-time monitoring, instant alerts, and automated summarizations, users can make faster, data-driven decisions across various business functions.
Features
- AI Insights: Automated data analysis and instant insight generation using AI.
- Natural Language Queries: Ask questions in plain English to get immediate answers.
- Real-Time Analytics: Monitor and analyze live data streams for instant decisions.
- Self-Service Analytics: Empower all users to create visualizations with no coding required.
- Data Integration: Connect to major relational databases and data warehouses with pre-built connectors.
- Drag-and-Drop Interface: Build dashboards intuitively without technical expertise.
- Automated Summarization: Get AI-generated key takeaways including trends, outliers, and patterns.
- Data Alerts: Set up instant notifications for key metric changes.
- Collaboration Tools: Share dashboards and reports in one click, supporting real-time collaboration.
- Fine-Grained Permissions: Control user access and roles for data security and compliance.
Use Cases
- Generating real-time sales analytics and performance dashboards.
- Empowering non-technical business teams to perform self-directed data analysis.
- Monitoring operational metrics and receiving instant alerts on critical changes.
- Visualizing marketing campaign performance across various channels.
- Streamlining financial reporting with automated trend and outlier detection.
- Collaborating on business reports and sharing insights with cross-functional teams.
FAQs
-
Does Grafieks require coding skills to use?
No, Grafieks features an intuitive drag-and-drop interface that allows users to create dashboards and visualizations without any coding experience. -
How is my data kept secure on Grafieks?
Grafieks employs end-to-end encryption and strict access controls, and only stores data schema—not the actual data—ensuring privacy and security. -
Can Grafieks connect to my existing databases?
Yes, Grafieks supports integrations with a wide range of relational databases and data warehouses, including MySQL, PostgreSQL, Microsoft SQL Server, and more. -
What kind of support is available for users?
Users on the free plan receive standard email support, while paid users have access to priority support and a dedicated account manager. -
Is there a free trial available?
Yes, Grafieks offers a free forever plan and a 14-day free trial for its standard features.
Related Queries
Helpful for people in the following professions
Grafieks Uptime Monitor
Average Uptime
99.86%
Average Response Time
600.9 ms
Featured Tools
Join Our Newsletter
Stay updated with the latest AI tools, news, and offers by subscribing to our weekly newsletter.


