 Rubii: AI Character Community

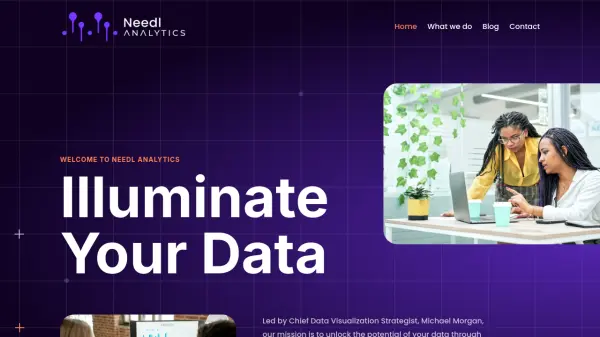
What is Needl Analytics?
Needl Analytics offers expert-driven services in data visualization and business intelligence, led by Chief Data Visualization Strategist Michael Morgan. Focused on empowering organizations and professionals, the platform delivers tailored consulting, hands-on workshops, and BI solution development that transform raw data into actionable insights. With a practical, real-world approach, Needl Analytics clarifies complex datasets and helps users to not only visualize trends but also drive meaningful outcomes.
From custom consulting to interactive training on tools such as Power BI, Tableau, and D3.js, Needl Analytics caters to varying expertise levels. Its resources, tutorials, and case studies guide users through the complete data storytelling process, ensuring that strategic decisions are supported by clear, insightful analytics and compelling visual communication.
Features
- Custom Consulting: Bespoke data visualization strategies and decision-making support.
- Workshops and Training: Interactive training on data visualization fundamentals and advanced tools.
- BI Solutions Development: End-to-end creation of dashboards, data integration, and analytics reporting.
- Expert Guidance: Insights and advice grounded in real-world application from data visualization specialists.
- Educational Resources: Access to tutorials, case studies, and best practices in data visualization.
Use Cases
- Developing custom data dashboards for business monitoring.
- Training teams to use Power BI, Tableau, or D3.js for data visualization.
- Consulting on visualization strategies for company decision-makers.
- Integrating analytics and reporting tools into business workflows.
- Enhancing presentations with compelling, clear visual data stories.
Related Queries
Helpful for people in the following professions

Featured Tools
Join Our Newsletter
Stay updated with the latest AI tools, news, and offers by subscribing to our weekly newsletter.