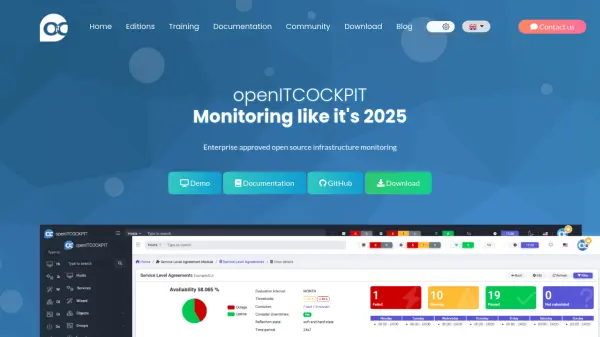
What is openITCOCKPIT?
openITCOCKPIT provides a comprehensive monitoring framework designed to oversee bare metal servers, virtual machines, network devices, containers, cloud platforms, and IoT equipment. It features an intuitive web interface for configuration and visualization, integrates with Nagios, Naemon, and Prometheus engines, and comes equipped with its own cross-platform monitoring agent for Windows, Linux, and macOS. Users benefit from secure, encrypted communications, customizable dashboards—including built-in Grafana integration—and seamless alert and report generation capabilities.
The platform supports a wide range of plugins and community-contributed extensions, enabling extensive scalability and adaptability for complex IT environments. Automated update handling, SLA and availability reporting, event correlation, maintenance scheduling, ITSM integration, and a powerful WYSIWYG map editor empower organizations to centralize and streamline their monitoring, alerting, and visual analysis processes efficiently.
Features
- Web-Based Configuration: User-friendly frontend for setup and visualization.
- Multi-Engine Support: Integrates with Nagios, Naemon, and Prometheus.
- Custom Monitoring Agent: Available for Windows, Linux, and macOS with out-of-the-box metrics collection.
- Plugin Compatibility: Supports thousands of community plugins.
- Customizable Dashboards: Includes traffic lights, gauges, tables, and auto-refresh capabilities.
- Grafana Integration: Auto-generates dashboards and supports custom user-defined Grafana dashboards.
- Reporting & SLA: Offers manual and scheduled reporting in multiple formats, including PDF, HTML, and CSV.
- Event History and Correlation: Maintains a timeline and correlates events for business-oriented monitoring.
- ITSM Integration: Supports incident management and automated data import from service management systems.
- Security by Design: Features encrypted communication via TLS/SSL by default.
Use Cases
- Monitoring IT infrastructure for enterprises and large organizations.
- Visualizing real-time performance data for servers, networks, and applications.
- Centralizing alert management and reporting on availability and SLA metrics.
- Integrating with existing DevOps and ITSM workflows.
- Tracking and correlating infrastructure events to business services.
- Generating custom reports for compliance and operational review.
- Automating notifications and scheduled maintenance windows.
FAQs
-
What operating systems does the openITCOCKPIT monitoring agent support?
The monitoring agent supports Windows, Linux, and macOS platforms. -
Can openITCOCKPIT integrate with Grafana for custom dashboards?
Yes, openITCOCKPIT includes built-in Grafana integration and can auto-generate dashboards as well as support user-created ones. -
Does openITCOCKPIT support encrypted communication?
Yes, TLS/SSL encrypted communication is enabled by default for secure monitoring and data transfer. -
What formats are available for generating reports in openITCOCKPIT?
Reports can be generated in PDF, HTML, and CSV formats, available either manually or on a scheduled basis.
Related Queries
Helpful for people in the following professions
openITCOCKPIT Uptime Monitor
Average Uptime
99.58%
Average Response Time
754.73 ms

Featured Tools
Join Our Newsletter
Stay updated with the latest AI tools, news, and offers by subscribing to our weekly newsletter.