 Rubii: AI Character Community

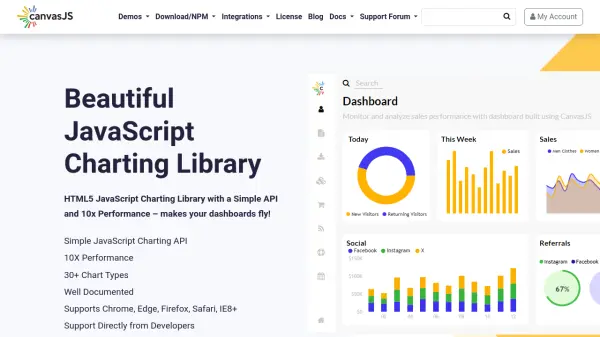
What is CanvasJS?
CanvasJS is an advanced JavaScript charting library designed to facilitate the creation of high-performance and responsive HTML5 charts for web applications. Supporting more than 30 chart types—including line, bar, spline, pie, doughnut, and stock charts—CanvasJS delivers extensive customization to meet varied data visualization needs.
This versatile library integrates seamlessly with major frameworks and libraries such as React, Angular, Vue.js, jQuery, and numerous backend technologies. With a simple and well-documented API, users can implement interactive, theme-rich dashboards that render rapidly—even with large datasets—across devices and browsers.
Features
- Simple Charting API: Intuitive JavaScript API for easy chart creation
- 30+ Chart Types: Wide variety of chart options including line, bar, pie, candlestick, and more
- 10X Performance: Optimized rendering for large datasets with rapid load times
- Cross-Platform Support: Renders charts on all major browsers and devices
- Framework Integration: Supports React, Angular, Vue.js, jQuery, PHP, Python, ASP.NET, and more
- Rich Interactivity: Includes zooming, panning, tooltips, and live updates
- Multiple Themes: Choice of attractive, customizable themes
- Multiple & Logarithmic Axes: Supports complex axis configurations
- Extensive Documentation: Well-maintained guides and reference materials
- Dedicated Support: Direct assistance available from the development team
Use Cases
- Building interactive business dashboards
- Visualizing financial and stock market data
- Integrating real-time data visualization into web applications
- Creating analytics portals for SaaS products
- Adding dynamic charts to e-commerce reporting tools
- Reporting and monitoring for performance metrics
- Embedding data visualizations in educational platforms
- Developing scientific or technical data dashboards
FAQs
-
Which frameworks does CanvasJS support?
CanvasJS supports integration with React, Angular, Vue.js, jQuery, and backend technologies such as PHP, Python, and ASP.NET. -
How many chart types are available?
CanvasJS offers over 30 chart types, including column, line, area, pie, doughnut, candlestick, and more. -
Is CanvasJS suitable for large datasets?
Yes, CanvasJS is optimized for high performance and can render charts with up to 100,000 data points efficiently. -
What kind of support is available for users?
CanvasJS provides support directly from developers, along with detailed documentation and a support forum.
Related Queries
Helpful for people in the following professions
CanvasJS Uptime Monitor
Average Uptime
99.57%
Average Response Time
112.6 ms

Featured Tools
Join Our Newsletter
Stay updated with the latest AI tools, news, and offers by subscribing to our weekly newsletter.